TOT-PE Conversion For Milagrito
Kelin Wang
University of California, Riverside
September 17, 1997
The central idea of TOT-PE conversion is the Reverse Logarithm Fitting (RLF) method, the whole process presumably includes 4 parts: 1-PE, transformer, RFL and reconstruction. Normally 10,000 events are enough for each time we do the calibration.
1 Polynomial Fitting
The first method of doing the TOT-PE conversion is to fit the ADC(PE) vs TOT(ns) histogram of each tube respectively, in which a fifth order polynomial is used for the Low TOT and a fourth order polynomial is used for the High TOT.
The result for the 1st method is fine, however it takes quite a long time to finish all the 240 tubes, because in high PE regions the statistic are bad as there are fewer events. In order to make a successful fit, some cuts need to be applied to that tube. However, different tubes require different cuts, there are no criteria of these cuts, so that it is impossible to do all the fits in an iterational computing program. Besides, different cuts drops the credibility of the result.
The calibration needs to be repeated once every 3 or 4 months, however, it took about 2 months to finish all the Milagrito TOT-PE conversion by using polynomial fitting, for Milagro there are about 800 PMTs and some igloos , it will take longer time to do the fit, so the polynomial method is not good enough for calibration, a more powerful fitting method is needed.
2 Reverse Logarithm Fitting (RLF)
Actually we should draw a distribution of TOT vs ADC, instead of ADC vs TOT. In the TOT vs ADC histogram, for each ADC channel all the TOT values for this channel are summed up, whereas in the ADC vs TOT histogram, for each TOT channel all the ADC values (in PEs) for this channel are summed up. These two histograms are different in statistic, in which the TOT vs ADC histogram has the reality of the performance of the electronics in the experiment. Under this consideration, I tried to develop a new method of TOT-PE conversion: the Reverse Logarithm Fitting ( RLF) method.
In the TOT vs ADC distribution, the theoretical function should be logarithm in the region the TOTĀ is not saturated. For Low TOT, the saturated point is roughly 7 PEs, so only the region below 7 PEs of the histogram needs fitting; For High TOT, the start point of fitting is roughly 5 PE, the rest of the histogram is fit.
So the fitting function for TOT vs ADC (PE) is:
f(x) = P1 * log(P2 * x) + P3;
in which f(x) stands for TOT(ns), x stands for ADC(PE), P1, P2, P3 are fitting parameters.
Having acquired the result of fitting, we will use them to convert the TOT into ADC, which means, we need to find the mathematical expression of ADC as a function of TOT, so the reverse function of f(x) is needed, and that's the reason this method is called "Reverse Logarithm". The reverse function of f(x) is exponential:
g(x) = exp[(x-P3) / P1] / P2;
in which g(x) stands for the unknown ADC(PE), x stands for the TOT data.
Click here to see the diagram of this method.
3 Conversion Preocess
3.1 Peak-finder and Peak-fitter Codes
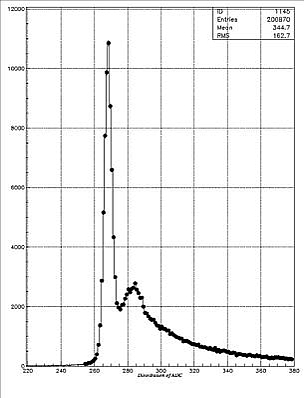
The first step of conversion is to find out how many ADC counts equals one-PE, or the one-PE value of each PMT. The raw ADC distribution of each tube should have 2 peaks, (as shown in Figure 3.1, left) the pedestal and the 1-PE peak: the pedestal peak is formed by dark noise, the tube emits thermal electrons even if no photon gets into the tube; when photons hit the tube, it is most probable that only one photo-electron is produced, which forms the 1-PE peak. The difference between the pedestal and the 1-PE readout in ADC channels is the one-PE value.
The peak-finder code, which was originally developed by Morgan Wascko, will load the raw data and calculate the positions of both pedestal and 1-PE peaks, and output 2 data files: the positions data file and the distribution of ADC of each tube, which is a histogram file.

The peak-finder gives a good position for the pedestal, and a roughly good position for the 1-PE peak,(as shown in Figure 3.2, right) the peak-fitter, a MACRO code in PAW which was developed with the help of Andy Smith, will use the positions as good starting points, and get fit result for the peaks, because both pedestal and 1-PE peaks have Gaussian shapes. Compare the result of the peak-finder and peak-fitter, we can see these two steps are necessary.
3.2 The Transformer Code
The second step of the conversion is to transform the raw data into TOT vs ADC histograms. The "transformer", a C code developed by me, which calls 2 subroutines in C, the getEdge.c (the edge-finder) and the data-read.c. will load the raw data into 2-dimensional histograms by using the result of 1-PE values.
The edge-finder was developed by Scott Hugenberger, which is a C code that will convert all raw data events into either 2-edge events or 4-edge events, the detail are described in the memo which written by Scott H.
3.3 The 2-dimensional Histogram Fitter (2d fitter) Code
The 2d fitter, a MACRO kumac code developed by me as well, will fit the result of the transformer by using the RFL method discribed above. Actually the 2d fitter includes three kumac codes, two of which are for Low TOT, and one for High TOT.
3.3.1 2d Fitter for Low TOT
The low TOT rises exponentially till 580-630 channels, and gets saturated above 680-700 channels (as shown in Figure 3.3, right), the critera differ from tube to tube. Here is a typical distribution of low TOT. Presumbly, the RLF method is good for the region below 580-630, however, there are some 2-edge events which have the low TOT above this critetia. So I construct the 2d fitter for low TOT by two parts, the 1st part, which is appliable for low TOT less than 580-630, is called allgfit_low.kumac; the 2nd part, which is for low TOT larger than this criterium, is called allgfit_mid.kumac. Both parts use the RLF method, but with different fitting parameters.
3.3.2 2d Fitter for High TOT

The high TOT rises as an exponential curve pefectly, (as shown in Figure 3.4, right) without getting saturated within current signal size, so the RFL method is quite O.K. for all of the high TOT regions.
3.3.3 Speed of 2d fitter
Since the 2d fitter includes MACRO kumac codes, all the fittings will be done automatically. In Milagrito there are 228 tubes, which means there are 684(228x3) 2-dimensional histograms, it takes me about 15 minutes (real time) to finish, in Milagro there will be 790 tubes, it will take about 45 minutes to complete if there is no further improvement for the fitter. This speed is O.K. even if we do the calibration once a week.
Here are some sample of fittings below, the left, Figure 3.5, is created by allgfit_low.kumac, the center, Figure 3.6, is by allgfit_hi.kumac, and the right, Figure 3.7, is by allgfit_mid.kumac.


4 Reconstruction of ADC
4.1 The Criteria File
The reconstruction code will use the results of the 2d fitter to get ADC values according to both low TOT and high TOT, however, since we have 3 groups of fitting data, there should be overlap regions for each PMT, which needs some criteria to determine where to use the right information. According to the result of the 2d fitter, we may get this information, and write all of the criteria of TOT into a data file called Criteria File.
4.2 The Weight Code
In the region in which the low TOT is 680-700, normally the low TOT begins to get saturated and the high TOT is just starting. Since there are 2 measurements of an event, both low and high TOT, we would like to use both pieces of information, the weight code is developed to calculate the weights. To do this we need to examine the distribution of the RMS of ADC at a specific TOT region, for example, 5 channels.
The result is, however, that the weight of low TOT at this region is close to zero, and the high TOT weight roughly equals 1.0, the reason is that the low TOT is saturated so that the ADC distribution has a huge standard deviation, the low TOT doesn't tell the reality of measurement of the events.
For convenience, we just give weights to the high TOT and low TOT according to the result of the weight code in the overlap region, without passing through the weight code each time we do the calibration.
4.3 Reconstruction
As it said above, the reconstruction code will use the data of the 2d fitter and those of the criteria file to get the corresponding ADC value (in PE) of each event. The reconstruting function is the exponential function, the reverse function of the logarithm. In overplap regions, presumably we use both information, with the weight given.
For a specific grid, suppose the criteria which we read from the criteria file is C1, then the reconstruction should be done like this:
For a 2-edge event:
if Low TOT < (C1-5), use low-fit result;
if Low TOT >= (C1-5), use mid-fit result .
For a 4-edge event:
if Low TOT <(C1-5), use results fot both low-fit and high fit with different weights;
if Low TOT >=(C1-5) and Low TOT <(C1+60), use results for both mid-fit and high-fit with different weights.
if Low TOT >= (C1+60), use result for high-fit only.
5 Result of RLF Method
Comparing the fitting result to the real ADC data (in PEs), we can see
the error of the RLF method for each grid. Presumably all grids have similar
error, which shows systematically the RLF method is fine. Here are some
Figures on error analysis: 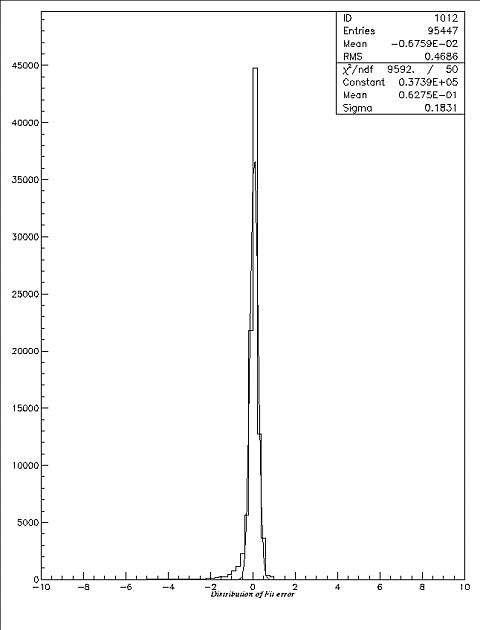
Figure 5.1. The distribution of relative fitting deviation for one grid.
For each event, I use the real ADC (in PEs) subtract the conversion PE value from TOT, divided by ADC, to obtain the relative error of each event. The distribution counts some 100,000 events. The distribution is Gaussian except a tail (see Figure 5.3), the mean is between 0.05 to 0.10, the sigma is less than 0.20 for all the tubes.
 Figure
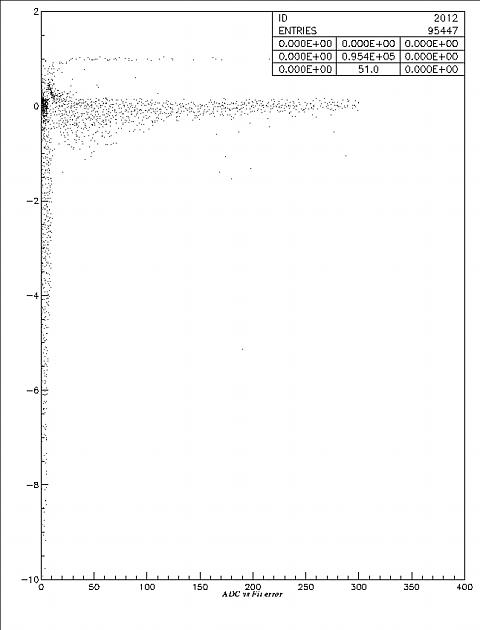
5.2. The distribution of relative fitting deviation vs ADC (in PEs) for
one grid.
Figure
5.2. The distribution of relative fitting deviation vs ADC (in PEs) for
one grid.
The horizontal axis is ADC, and the vertical axis is the relative fitting error, the same variable as in Fig 5.1. We can see that, for higher ADC the error becomes smaller, the tail contributes to the late hits in the ADC gate in which the ADC count is close to zero but the TOT is still high.

Figure 5.3. The distribution of relative fitting deviation vs high start of TDC for one grid.
The horizontal axis is the high start of the TDC, the vertical axis is the relative fitting error. This figure shows that the high start ranges from 1300 to 2200 channels, events with both small relative fitting errors and large relative fitting errors appear to have the same high start region, especially at higher region (1900~2200). So the bad events cannot be cut by the RLF software.
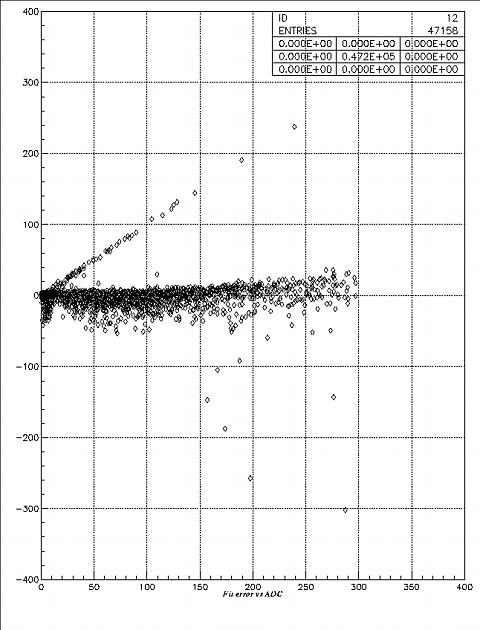 Figure
5.4. The distribution of fitting error (in PEs) vs ADC (in PEs) for one
grid.
Figure
5.4. The distribution of fitting error (in PEs) vs ADC (in PEs) for one
grid.
The horizontal axis is ADC, the vertical axis is the deviation between the fitting result and the ADC. We can see that the deviation doesn't change too much when ADC increases, so the relative fitting error drops when the ADC increases.