On Drifts
 While looking at muon signals in
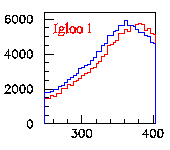
igloos, I came across the following oddity. Check out this here graph (also shown at
right) of the one-PE peak in low TOT for igloo #1. The red line is the
peak in May, the blue line is the peak in September. Notice that the peak
has drifted down by more than a dozen counts. Some of the other igloos exhibit similar
behavior.
Let me mention a few things before I go on. First, I have normalized the
histograms so that the peaks have the same height. Second, although the
drifts in question are small, they are not negligibe, and they
appear(ed) to be systematic. In my analysis, I used eight subruns,
two consecutive files from each of four randomly chosen tapes. The runs in
question were 54_50,51 (from March 20), 226_73,74 (May 25),
423_58,60 (Aug 20) and 484_47,48 (Sept 14). We have, as
I'm sure everyone is aware, but four ADC cards which must be moved around
frequently, which means that ADC data do not exist for all tubes at all
times. Often, the only way to know whether a particular patch was
connected to an ADC card at a given time is to look at the data themselves,
since changes in the card arrngement have not always been logged. (And
occasionally the appropriate changes have not even been made to the ADC map
file, which means that some data have been lost to us.) Also, there is
no way to know which actual card was plugged into which slot at any given
time in the past. Anyway, the point is that when looking at ADC data, I
had to take what I could get.
I was prompted to discover this behavior in the first place when it was
seen that the muon peaks in the
igloos had similarly shifted, and Cy suggested that I check the one PE peak
postition to be sure that I understood the origin of the muon peak shift.
If the muon peak postion had drifted down but the one-PE peak position was
constant, then I could pretty safely say that it was due to a change in the
number of PEs that were hitting the igloo tube in a muon hit, which would
indicate a change in the water quality. This was not the case.
 The next step was to look at the rest of
the tubes and see if they displayed similar behavior. Initially, it
appeared as if they did. I began with some tubes in the first patch,
looking at two subruns for each tube inspected, both ADC and TOT data. I
examined the positions of the one PE peaks as a function of time in these
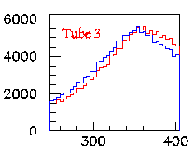
data. Shown at left is the one PE peak for tube 3 in low TOT. Again, the red
line is the earlier peak, this time from March, and the blue line is from
September again.
 The ADC equivalent of a TOT one-PE peak
shift is a change in the difference between the one-PE peak and the
pedestal peak, which I will call delta. So I also looked at the ADC
spectra. There I found some confusing behavior in the first tubes that I
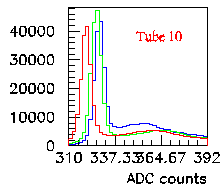
examined. Take for example tube
10. The pedestal drifts down as a function of time, while delta jumps
up between March and May, but is nearly unchanged between May and
September. The ADC behavior of tube
15 also changes as a function of time, but in a different way. Here
the pedestal gradually drifts down over time as well, but now delta drops
down from March to May, and is again constant from May to September. These
tubes are both in patch 1. My first look at patch 2 showed something a
little different. Tube 25 shows
basically no change in delta, but the pedestal positions drops 4 channels
from May to September after remaining constant between March and May. That
seemed strange to me. "So how about patch 3?" thought I. Well,
my first look at patch 3, tube 35,
showed what looked like plain old pedestal drift. Here I saw no change in
delta, and a consistent downward drift in the pedestal peak position.
Eventually I decided that this hunt and peck
method of data analysis was wasting time, so I automated the process some.
Using some PAW macros, I fitted the one-PE peak of each tube's TOT data,
and the one PE and ped peaks from each tube's ADC data, from the first
three patches (for which I had ADC data as well as TOT) and dumped
these numbers to a file. Then I found the change in (TOT) one PE
peak position and (ADC)delta between each of the successive runs
that I was using. Below I have two tables which contain the changes in TOT one PE peak position and ADC delta for each tube in the first three patches.
Below these I have the mean and standard deviation
of the TOT one PE peak shift for the first three patches and then a
several extra patches for good measure. What I see in these numbers, and I
hope you'll agree with me, gentle reader, is that there is no systematic
drift in the one PE peak position. I see nothing characteristic about
these changes. I don't know exactly what lesson this should teach us.
Certainly it should illustrate the importance of frequent adc calibrations.
So, to prove to you that I'm not a liar, let me show you some numbers.
ADC
Change in delta in ADC channels between the months indicated.
DISCLAIMER:The following datafiles were
corrupted somehow when I was writing this html crap. Any number greater
than 50 should be disregarded. In such a case, assume that there is no
datum, and check back in a day to see the real result.
| Chan |
March-May |
May-Aug |
Aug-Sept |
May-Sept |
|---|
| 1. | -15.016998 | 46.994995 | -51.348999 | -4.354004 |
| 2. | -1.845993 | 31.840988 | -31.304993 | 0.535995 |
| 3. | 2.649979 | 28.284012 | -27.187012 | 1.097000 |
| 4. | -10.062988 | 29.797989 | -29.748001 | 0.049988 |
| 5. | 21.640015 | 17.875000 | -17.051971 | 0.823029 |
| 6. | -4.059021 | 37.046021 | -36.393005 | 0.653015 |
| 7. | -5.864014 | 30.210999 | --- | --- |
| 8. | 11.011993 | 23.424011 | -22.920990 | 0.503021 |
| 9. | 7.628998 | 32.333008 | -141.092987 | -108.759979 |
| 10. | -14.000000 | 39.054993 | -38.825989 | 0.229004 |
| 11. | 1.740982 | 22.941010 | -21.180008 | 1.761002 |
| 12. | 4.666016 | 23.580994 | -24.164001 | -0.583008 |
| 13. | --- | --- | --- | --- |
| 14. | -8.686951 | 28.217957 | -26.663025 | 1.554932 |
| 15. | 11.434998 | 18.362000 | -17.064011 | 1.297989 |
| 16. | --- | 28.151978 | -27.721985 | 0.429993 |
| 17. | --- | --- | -0.065994 | --- |
| 18. | --- | 0.864014 | -0.187988 | 0.676025 |
| 19. | --- | 9.871017 | -0.548996 | 9.322021 |
| 20. | 0.000000 | --- | -0.626999 | --- |
| 21. | --- | 2.384995 | -0.175995 | 2.209000 |
| 22. | --- | --- | 48.000000 | --- |
| 23. | --- | -0.391998 | -0.391998 | -0.783997 |
| 24. | --- | 1.283020 | -0.713013 | 0.570007 |
| 25. | -6.980011 | 8.967010 | 0.428009 | 9.395020 |
| 26. | 0.030975 | -1.078003 | 0.667999 | -0.410004 |
| 27. | 0.111504 | -0.927406 | -0.033691 | -0.961098 |
| 28. | 4.065002 | 1.152008 | 0.320984 | 1.472992 |
| 29. | 0.692017 | 1145.739990 | -1145.770996 | -0.031006 |
| 30. | 4.610016 | 1738.703003 | -184.00 | 1554.703003 |
| 31. | --- | --- | -43.545700 | --- |
| 32. | 16.273010 | -16.967987 | -0.014023 | -16.982010 |
| 33. | 20.071014 | -1.486969 | --- | --- |
| 34. | 20.660004 | -1.220978 | 1.286957 | -20.594025 |
| 35. | 23.975006 | -0.423004 | 0.774017 | -23.623993 |
| 36. | 30.393005 | -2.047974 | 2.210968 | -30.230011 |
| 37. | 19.063995 | 0.078979 | -0.117981 | -19.102997 |
| 38. | 28.033020 | 3.104004 | -0.478943 | -25.407959 |
| 39. | 29.523010 | -1.622986 | 0.440002 | -30.705994 |
| 40. | 30.287964 | 2.172974 | 1.091980 | -27.023010 |
| 41. | 26.818008 | -2.463974 | 0.672974 | -28.609009 |
| 42. | 18.320007 | 1.080994 | 0.149017 | -17.089996 |
| 43. | 17.318008 | 0.826210 | -0.592201 | -17.084000 |
| 44. | 16.152008 | --- | --- | -18.831009 |
| 45. | 16.498962 | 0.075989 | 0.255981 | -16.166992 |
| 46. | 23.164001 | 1.712006 | 0.203979 | -21.248016 |
| 47. | 15.795990 | -0.729034 | -0.082977 | -16.608002 |
| 48. | 14.758598 | -0.708412 | 3.244411 | -12.222599 |
Go back to the discussion of these tables.
TOT
Change in one-PE peak position in low TOT channels between the months indicated.
DISCLAIMER:The following datafiles were
corrupted somehow when I was writing this html crap. Any number greater
than 50 should be disregarded. In such a case, assume that there is no
datum, and check back in a day to see the real result.
| Chan |
March-May |
May-Aug |
Aug-Sept |
May-Sept |
|---|
| 1. | 1.045990 | 477.891998 | -478.730011 | -0.838013 |
| 2. | 1.685974 | 386.028015 | -383.454010 | 2.574005 |
| 3. | 7.782990 | 358.194000 | -353.821991 | 4.372009 |
| 4. | 2.371002 | 386.993988 | -384.502014 | 2.491974 |
| 5. | 20.932983 | 283.811005 | -277.721985 | 6.089020 |
| 6. | 5.167999 | 418.338013 | -413.976013 | 4.362000 |
| 7. | 10.817017 | 392.316986 | -400.000000 | -7.683014 |
| 8. | 11.450989 | 345.654999 | -325.595001 | 20.059998 |
| 9. | 3.20700 | 390.902008 | -387.670990 | 3.231018 |
| 10. | 8.149017 | 426.868988 | -424.752991 | 2.115997 |
| 11. | 13.701996 | 356.816010 | -332.993011 | 23.822998 |
| 12. | 2.010010 | 357.834991 | -358.516998 | -0.682007 |
| 13. | 3.076996 | 367.187012 | -365.390015 | 1.796997 |
| 14. | 12.864990 | 382.770996 | -379.283997 | 3.487000 |
| 15. | 4.378021 | 310.437988 | -299.002014 | 11.435974 |
| 16. | 7.161987 | 388.752014 | -383.865997 | 4.886017 |
| 17. | 4.915985 | 3.788025 | 2.953003 | 6.741028 |
| 18. | 9.314026 | -1.444000 | 1.888977 | 0.444977 |
| 19. | 5.438019 | -2.919006 | 5.209991 | 2.290985 |
| 20. | .906006 | 0.768982 | 1.084015 | 1.852997 |
| 21. | 3.170013 | 2.894989 | -1.139008 | 1.755981 |
| 22. | --- | --- | --- | --- |
| 23. | -0.046997 | -9.373016 | -0.173981 | -9.546997 |
| 24. | -0.042999 | -0.352997 | 0.082977 | -0.270020 |
| 25. | 17.579010 | 15.608002 | 17.881012 | 33.489014 |
| 26. | 6.634979 | -7.740997 | 1.042999 | -6.697998 |
| 27. | 1.580994 | -10.184021 | 0.369019 | -9.815002 |
| 28. | 3.412994 | 6.377991 | 3.337006 | 9.714996 |
| 29. | 3.141998 | -0.828003 | 4.074005 | 3.246002 |
| 30. | -0.78198 | 8.868988 | 0.000000 | 8.868988 |
| 31. | -11.944992 | -7.701996 | 3.177994 | -4.524002 |
| 33. | 309.061005 | -1.863983 | -4.289001 | -315.213989 |
| 34. | 316.826996 | -5.056000 | 1.652985 | -320.230011 |
| 35. | 329.346985 | -0.872009 | -0.699005 | -330.917999 |
| 36. | 371.096985 | -5.980011 | 2.610992 | -374.46600 |
| 37. | 298.260010 | -3.399994 | 1.498016 | -300.161987 |
| 38. | 396.997009 | 20.735016 | 0.606995 | -375.654999 |
| 39. | 370.552002 | -17.710999 | 4.980988 | -383.282013 |
| 40. | 393.289001 | 10.723999 | 11.154999 | -371.410004 |
| 41. | 337.608002 | -11.088013 | 1.277008 | -347.419006 |
| 42. | 293.033997 | 3.121002 | 2.796997 | -287.115997 |
| 43. | 273.734985 | -0.892029 | 0.873016 | -273.753998 |
| 44. | 266.152008 | -8.847992 | 10.386993 | -264.613007 |
| 45. | 283.723999 | 0.328003 | -0.472015 | -283.868011 |
| 46. | 334.177002 | 15.744995 | 0.742004 | -317.690002 |
| 47. | 254.535995 | -3.948013 | 3.296005 | -255.188004 |
| 48. | 250.076996 | -1.960007 | 0.628006 | -251.408997 |
Go back to the discussion of these tables.
TOT Patches
| Interval | Mean | Std.Dev. |
|---|
| Patch 1 | March-May | 7.107061 | 1.381960 |
|---|
| May-Aug | 7.879940 | 2.229927 |
| Aug-Sept | 4.322245 | 1.414258 |
| May-Sept | 5.095123 | 1.862231 |
| Patch 2 | March-May | 3.519789 | .667747 |
|---|
| May-Aug | 3.487070 | 2.908187 |
| Aug-Sept | 2.842001 | 1.146451 |
| May-Sept | 2.682211 | 2.779901 |
| Patch 3 | March-May | 2.252248 | 1.211164 |
|---|
| May-Aug | -0.685377 | 2.344738 |
| Aug-Sept | 2.315311 | 0.936785 |
| May-Sept | -0.622313 | 1.603170 |
| Patch 4 | March-May | -1.701429 | 1.065861 |
|---|
| May-Aug | -1.291059 | 1.829134 |
| Aug-Sept | 1.352497 | 1.150724 |
| May-Sept | 1.762867 | 1.565443 |
| Patch 6 | March-May | -0.035248 | 0.383684 |
|---|
| May-Aug | -2.370308 | 1.098859 |
| Aug-Sept | 0.843312 | 0.192156 |
| May-Sept | -1.491748 | 0.972776 |
| Patch 8 | March-May | 0.851317 | 0.719191 |
|---|
| May-Aug | -1.469751 | 1.850026 |
| Aug-Sept | 0.644250 | 0.249579 |
| May-Sept | -1.676818 | 1.476499 |
| Patch 12 | March-May | -2.986755 | 1.048841 |
|---|
| May-Aug | -4.272066 | 2.651788 |
| Aug-Sept | 0.689379 | 0.449091 |
| May-Sept | -0.595932 | 3.072482 |
| Patch 14 | March-May | -0.919332 | 1.121656 |
|---|
| May-Aug | -5.043672 | 2.577475 |
| Aug-Sept | -0.133531 | 1.318627 |
| May-Sept | -8.746138 | 2.819755 |
| Patch 16 | March-May | 0.925537 | 0.954486 |
|---|
| May-Aug | 0.405601 | 1.444509 |
| Aug-Sept | 1.186534 | 0.583331 |
| May-Sept | 0.917531 | 0.715312 |
Go back to the discussion of these tables.
Morgan
Wascko Last
modified: Fri Dec 5 16:43:33 MST
 While looking at muon signals in
igloos, I came across the following oddity. Check out this here graph (also shown at
right) of the one-PE peak in low TOT for igloo #1. The red line is the
peak in May, the blue line is the peak in September. Notice that the peak
has drifted down by more than a dozen counts. Some of the other igloos exhibit similar
behavior.

