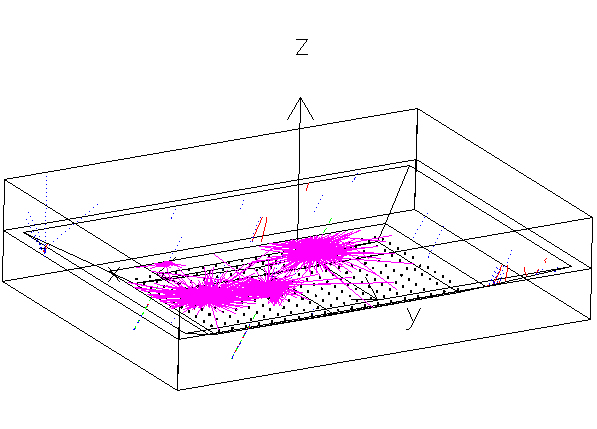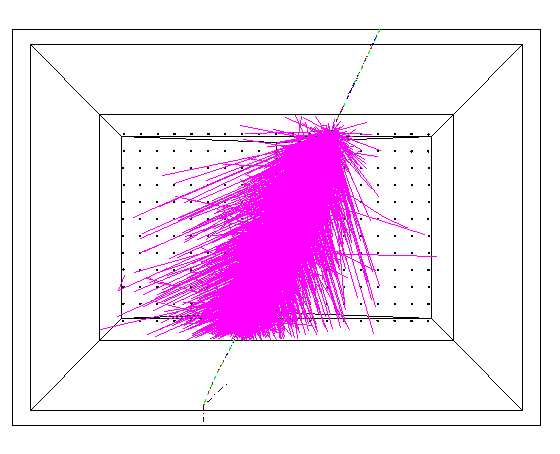

In order to get a feeling for curvature and sampling, the arrival times of particles on the pond
(i.e. no detector simulation) for a superposition of 10 vertical showers at 5 TeV
is shown in Fig. 6(a) (gamma showers) and
Fig. 6(b) (proton showers).
The MEAN arrival time clearly shows a "curvature" of about 20 ns per 100 m,
but the scatter plots indicate that the curvature as seen by MILAGRITO will be considerably smaller.
Mei-Li studied the effect of curvature by plotting the mean arrival time of the Cherenkov light at the
tubes as a function of distance to the core for gamma showers at 1 TeV energy and 0 degree incident angle
for different pulse heights.
The corresponding GEANT plot (Fig. 7) shows basically the same characteristics.
The curvature correction is approx. 4 ns / 100 m. For this plot, the exact (MC) core position is used
for calculating the distance.
Fig. 8 (a) shows the effect of (core-independent) sampling
corrections for the difference between the true (MC) angle and the fit (using the current
online angle fitter) and for DELEO, both for gamma- and proton showers.
I included a curvature correction of 4 ns/100 m using the fitted core position, and the angular
resolution is slightly better when this correction is applied. Using the MC core position,
I also tried to find the curvature correction which gives the best angular resolution.
See Fig. 8 (b) and
Fig. 8 (c) for details.
The median of the difference between true and reconstructed
angle and the median of DELEO as a function of the number of PMTs are given
in Fig. 9 (a).
Again, after applying a curvature correction of 4 ns/100 m using the exact (MC) core,
we get almost the same angular resolution from DELEO and Delta(angle). The
plot also shows that even using the fitted core improves the angular resolution. This may be
due to the fact that although the online core fitter does not find cores outside the pond,
it is able to roughly determine the direction to the core as seen from the middle of the pond.
Fig. 9 (b) shows the angle difference between the direction
to the fitted core and the direction to the true core.
Note that the same sampling correction is used in MC and experimental data. The current online
sampling correction together with the MC sampling correction (for gamma- and proton showers)
is shown in Fig. 10 (as the absolute time has no meaning here,
the constant term in the sampling correction is adjusted to the MC gamma data). The experimentally
determined sampling correction and the sampling correction from the MC proton and gamma data
are in good agreement.
Whereas our resolution gets better with energy for showers with core on the pond, this is not true
for the sample with showers on a 200 m times 200 m area
(Fig. 11 (a)). In fact, the larger number of showers with
core OUTSIDE the pond is responsible for this, as the angular resolution
decreases with distance of the core
to (0,0) (see Fig. 11 (b) (gamma-showers)).
To study the effect of multiple scattering (of particles) and reflection in the pond, 10 gamma-showers with 0 degree incident angle and 1 TeV primary energy are generated with and without taking into account reflection and/or multiple scattering. Fig.12 (a) shows the arrival time of the Cherenkov photons at the PMT tube vs the incident angle of the Cherenkov photon at the tube, Fig.12 (b) shows histograms of the incident angle of the Cherenkov photons at the tubes. The times are GEANT times only, i.e. all shower particles hit the top of the pond at the same time. The plots show that the main part of the late light seems to be due to multiple scattering.
Fig.13 (a) and Fig.13 (b)
show the effect of including total internal reflection for light leaving the pond at waterlevel, i.e.
assuming that there is (dielectric) air between the cover and the water (solid line = TIR). Assuming TIR
for the whole pond increases the number of triggers by about 25 %.
The chi(time) distributions for data and MC proton showers for different pe regions are compared
in Fig.13 (c) and Fig.13 (d).
This is for showers with more than 100 calibrated tubes. The distributions for pe-values above 3 pes are not shown, as there is no difference between data
and MC for high pes.

The effect of delty rays and reflection: for 100 single muons with 0 degree incident angles, Fig. 16 shows the number of PMTs without delta ray production and without reflection (a), including reflection (b), no reflection, but delta rays (c), and including both (d).
Wystan added baffles to the current MC PMT.
Here are some results on gamma-showers and
single muons with and without baffles. The baffles used for this test have 88 % specular
reflectivity on both sides, an opening angle of 48.4 degrees, and their rim is at the same height
as the top of the PMT (click here for a schematic
picture.
A rough look at the data shows that with an 80 tube trigger the number of events is about a third
of the number of events without baffles. We therefore have to change the trigger condition in order
to have the same EVENT RATE for the baffle and the non-baffle MC.
Fig. 16 shows the number of events in 20,000 gamma-showers
that have more than n tubes as a function of n for the baffle and the non-baffle MC. A trigger
condition of 80 tubes for the non-baffles thus corresponds to a trigger condition of 47 tubes
for the baffles. Compare Fig. 17 to Fig. 14
to see that the baffles efficiently eliminate single muons. Statistics is chronicly poor, so take this as
an upper limit.
Fig. 18 shows the mean number of tubes tossed by the angle fitter as
a function of the total number of PMTs in the event. With baffles, the number of tossed tubes is smaller,
as you would expect if a part of the tubes in the non-baffle event is not related to the shower front.
Fig. 19 shows the angular resolution (i.e. the mean angle between true
and reconstructed shower direction) as a function of the number of tubes in the event and as a function
of the number of tubes used in the fit.
Fig. 20 finally shows the trigger efficiency as a function of
primary energy and incident angle for a 47 tube (baffle) trigger and an 80 tube (non-baffle) trigger.
We still have to analyze how the baffles affect proton showers and thus influence gamma/hadron separation.
Furthermore, showers with energies below 500 GeV have to be generated to study baffle events with 25
or more tubes (a trigger condition that would give about the same SINGLE MUON RATE as
an 80 tube non-baffle-milagrito).
Fig. 21 shows the chi-distribution for the tube times with baffles (dotted)
and without baffles (solid line). Large negative chis in this plot indicate LATE light.
In order to check whether we still expect a pointing error in our angle fitting,
Cy suggested looking at the x- and y-distribution of the data, where
The files used for these analyses are in /slug00/mcdata. You can read them with
Rich's DataRead.c program just like data, but the time and pe information for each
tube is stored in the calData structure. MC information (incident angles, core positions,...) can be found in
the monteInfo structure (take a look at procData.h). The core positions refer to the
top of the water.
Each file comprises 20000 events, the numbers refer to the corresponding CORSIKA file in /slug00/stefan/corsika.
x = sin(theta) cos(phi)
y = sin(theta) sin(phi)
As the maximum shower intensity MUST come from zenith, any deviation from (x,y)=(0,0)
should indicate pointing errors. I did some MC studies showing that (at least in the MC)
this symmetry is NOT destroyed by the number or position of the dead tubes or by the
fact that MILAGRITO is not symmetric in phi.
To show whether this method is sensitive to pointing errors, we plot the x- and y-distribution
for the old calibration and the new calibration, as we know from Peter that we had a
systematic error in the old calibration.
Fig. 22 shows x and y for the old and the new calibration.
The same runs were used, and there is a cut on theta (theta < 60 deg) to avoid being
influenced by things happening at large theta (muons ?). This cut turns out to have no
influence on the result. The mean of the distributions is shifted by
x-direction: -0.0311 (old) -0.0044 (new)
y-direction: -0.0103 (old) -0.0095 (new)
The error is of the order 0.0005.
Fig. 23 shows the deviation
from (x,y)=(0,0) as a function of theta, with the overall shifts as dotted lines.
Peter's east-west shift (x-direction) with the old
calibration can easily be seen, but the plots also indicate that we may still have
a north-south problem (y-direction).
We are actually looking at tiny shifts, but the amount of
data is practically infinite.
In addition, Fig. 23 shows the phi-distribution
with the old and the new calibration, showing that we improved, but it is still not flat.
Where is the data ?
Thanks to Morgan for helping to construct this page.
Stefan Westerhoff