
Balloon Flight Environmental Data
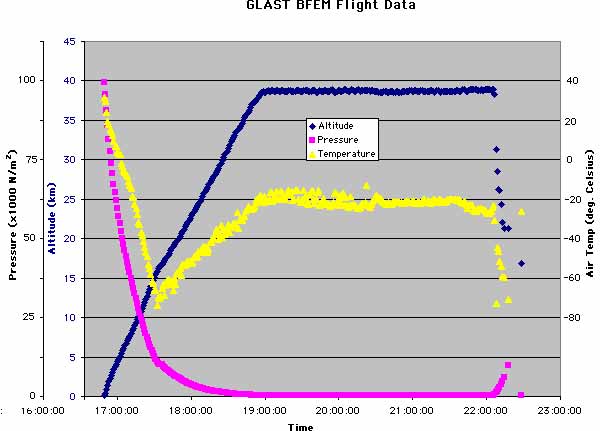
Note that as all the atmospheric models we've examined predict, air pressure plunges dramatically at high altitudes. The sharp kink in the relationship between altitude and temperature that occurs 12 km above the earth's surface. The dependence of temperature on altitude is more complex. For the first fifteen to twenty kilometers above the earth's surface, the air grows progressively colder with altitude, a phenomenon familiar to any mountain climber. At this point, though, the data show a sharp kink, and the air begins growing warmer as the baloon ascends...
How to these findings stack up against the predictions of our simple exponential model of the atmosphere, or those of the more complex empirical model used by NASA and NOAA? Well, since weather varies from day to day, no model can be expected to predict the exact weather conditions encountered by a given flight. But let's find out how close they came:
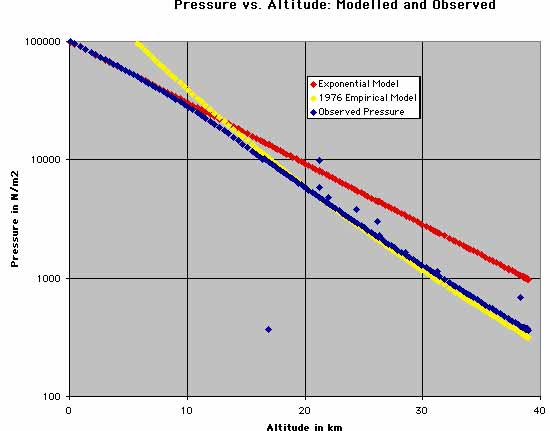
Since pressure varies by several orders of magnitude, we've placed the vertical axis on a logrithmic scale. (Otherwise, either the low-altitude data would be off the scale, or the high-altitude data would be scrunched into an unreadable pile near zero pressure.) Note that the simple exponential model predicts the pressure reasonably well up to 8 km or so, then becomes increasingly inaccurate. The NASA/NOAA/USAF empirical model, on the other hand, does very well at high altitudes. (Remember, it's designed to be accurate between 32 and 47 km.)
There are a few scatteredoutlying points that don't seem to match any of the models. Looking at the pressure-vs-time curve at the top of this page, can you tell when these measurements were taken? Refer to the story of the balloon flight in the teachers' Travel Log to see what was happening to the balloon during this part of the flight...

Recall that the simple exponential model of the atosphere assumed that the temperature is constant. The NASA/NOAA/USAF empirical model, on the other hand, predicts that temperature will increase steadily with altitude...and at the high altitudes where the model is designed to be used, this is apparently exactly what happens. (Though the summer weather over Texas, even high in the stratosphere, was a little warmer than the generic setting of the model...)