
One of the most useful features of Graphical Analysis is its capacity to graph modified data. This is extremely helpful in looking for the relationship between variables.
You can create two types of columns: manually entered and calculated. To create a manually entered column choose New Manual Column from the Data menu.
Enter the name and units for the new column. When finished, click OK
and the new column will be added to the table.
To create a new calculated column, choose New Calculated Column from the Data menu.
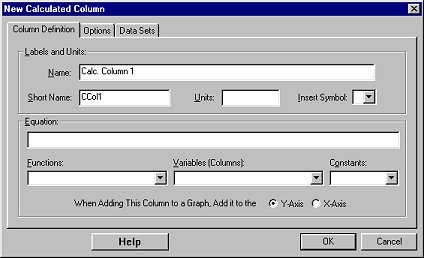
Enter the Name and Units for the new column. Under the Columns Formula
box is a menu listing all existing columns that you can use in defining
your new column. Here you can choose functions such as derivative, integral,
smoothing, etc. Use the Column Names and Constants pull-down menus when
defining the New Column. You can also type the names and functions in the
box. If you type in the name of a column in the equation field, you must
enclose it in double quotes.
See Also: