The Axis Options allows you to select which columns are plotted and how they are scaled.
The Axis Options dialog gives you the following options:
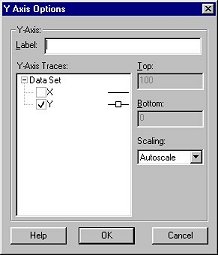
Scaling
The scaling options control how the limits of the graph are set. There are three scaling options available:
Autoscale: The software will choose an appropriate range
for the axes, based on the data being plotted.
From 0: Similar to Autoscale except that one of the endpoints
of the axes will be at zero and the other will be set based on the data
range.
Manual: In this mode, you can choose both endpoints of
the axis. Enter the minimum and maximum values to plot in the text boxes
under this option.
Top: Manually enter the
maximum value you wish to show on your graph (disabled if autoscaling is
chosen).
Bottom: Manually enter
the minimum value you wish to show on your graph (disabled if autoscaling
is chosen).
To quickly change the axis range, click on an end point value of the axis in the graph window. A box will appear allowing you to enter a new value.
Note: You can reverse the direction of the y axis so that more negative
numbers are higher on the y-axis. If you type in a number as the axis maximum
which is less than the axis minimum, the graph will draw correctly. If
you set a reversed axis range as mentioned above and the axis scale is
set to manual, it will stay that way. Zooming and unzooming preserve the
data direction. If you set a reversed axis range as mentioned above and
autoscale, the reversal is not preserved. Autoscale always used the standard
direction of data (min is min and max is max). If a column's data is all
negative, and autoscale-from-zero is set for the axis, the axis maximum
will be set to zero.
Label:
With this dialog box, you can change the name of the y-axis label.
Click OK to make your selections take effect.
See Also: