This page contains a summary of the results of the Physics 116A midterm and final exams for the Winter, 2010 academic quarter at the University of California, Santa Cruz.
FINAL EXAM (Tuesday March 16, 2010)
Solutions to the final exam can be found on the Physics 116A website. The exam was worth 160 points. Here are the relevant statistics. First, a histogram of the test scores is shown below: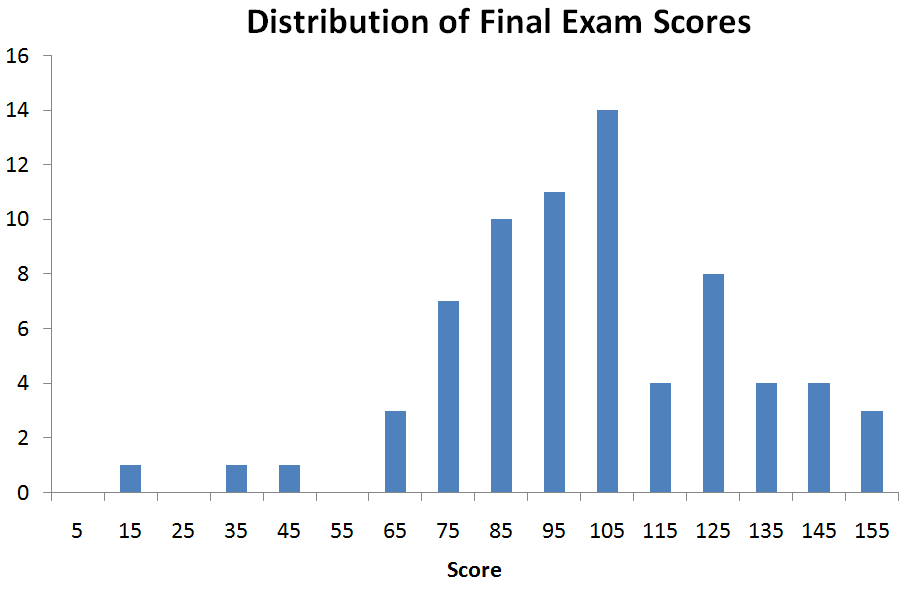
Horizontal axis labels correspond to the midpoint value of a bin, which is 10 points wide. Here is the midterm exam statistical summary:
exam mean: 102 exam median: 101 standard deviation 32 highest grade: 160 lowest grade: 16
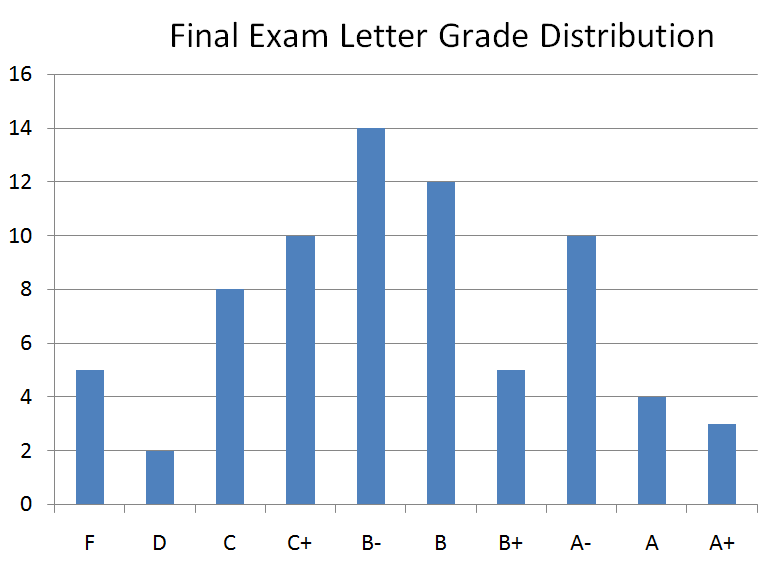
Approximate grade equivalents of the test scores: A+ (150-160); A (139--149); A- (127--138); B+ (115--126); B (103--114); B- (91--102); C+ (79--90); C(67--78); D(55--66), F (0--54). Keep in mind that the grade equivalents apply only to this exam, and take into account the distribution of final exam scores. The distribution of the grade equivalents for the final exam is shown below.
MIDTERM EXAM 2 (Tuesday February 23, 2010)
Solutions to the second midterm exam can be found on the Physics 116A website. The exam was worth 100 points, with the possibility of an additional 10 point extra credit bonus. Here are the relevant statistics. First, a histogram of the test scores is shown below: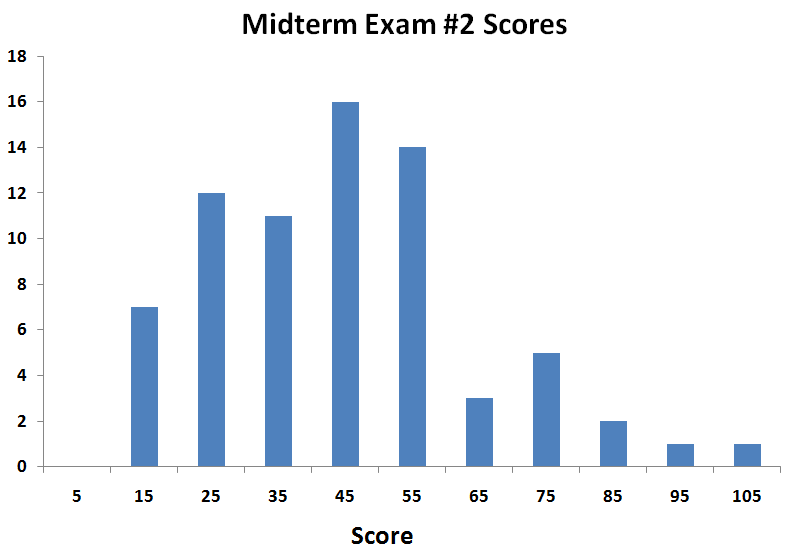
Horizontal axis labels correspond to the midpoint value of a bin, which is 10 points wide. Here is the midterm exam statistical summary:
exam mean: 45 exam median: 43 standard deviation 20 highest grade: 100+10 lowest grade: 15
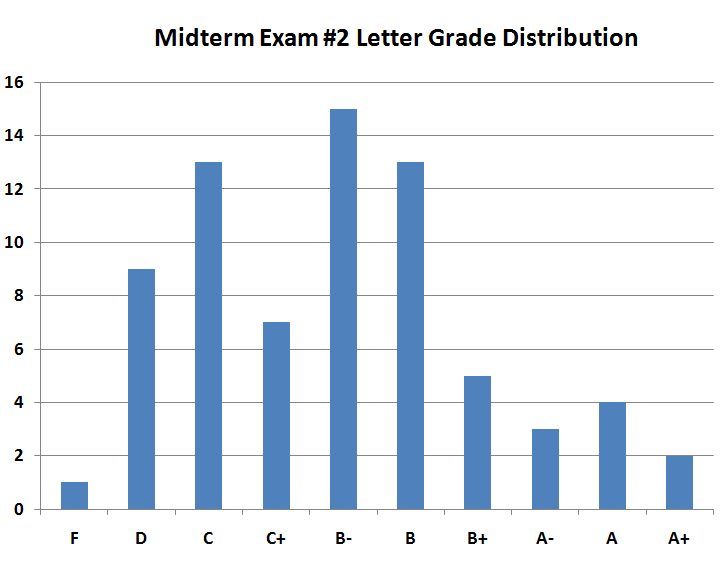
Approximate grade equivalents of the test scores: A+ (88-110); A (78--87); A- (68--77); B+ (59--67); B (50--58); B- (41--49); C+ (33--40); C(25--32); D(17--24), F (0--16). Keep in mind that the grade equivalents apply only to this exam, and take into account the distribution of midterm exam scores. The distribution of the grade equivalents for the midterm exam is shown below.
MIDTERM EXAM #1 (Thursday January 28, 2010)
Solutions to the first midterm exam can be found on the Physics 116A website. Here are the relevant statistics. First, a histogram of the test scores is shown below: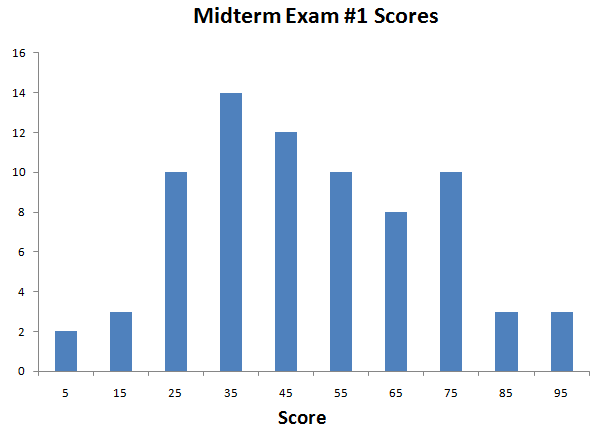
Horizontal axis labels correspond to the midpoint value of a bin, which is 10 points wide. Here is the midterm exam statistical summary:
exam mean: 50 exam median: 49 standard deviation 21 highest grade: 93 lowest grade: 8
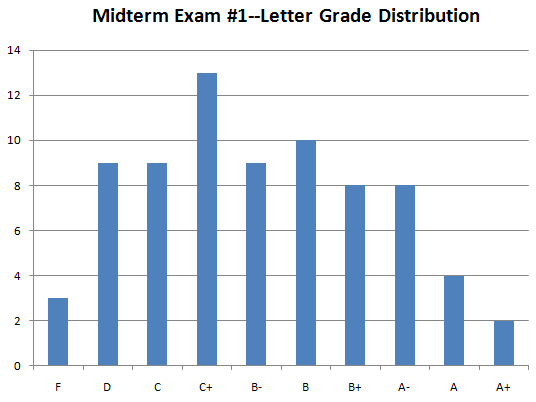
Approximate grade equivalents of the test scores: A+ (91-100); A (82--90); A- (73--81); B+ (64--72); B (55--63); B- (46--54); C+ (37--45); C(28--36); D(19--27), F (0--18). Keep in mind that the grade equivalents apply only to this exam, and take into account the distribution of midterm exam scores. The distribution of the grade equivalents for the midterm exam is shown below.
Back to the Physics 116A home page
haber@scipp.ucsc.edu
Last Updated: March 22, 2010