Draft Graph
You can fit a function either to the whole graph or just to a region
of interest. To select a portion of the graph, drag the mouse across the
desired region.
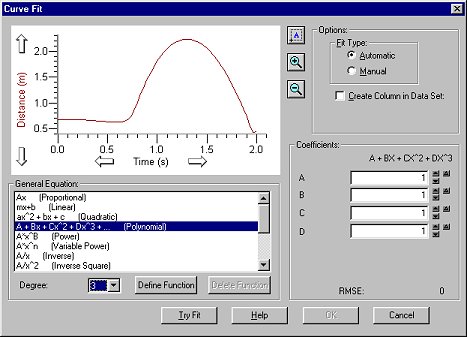
Options
Fit Type
Select which type of curve fit you would like to perform: Automatic or Manual.
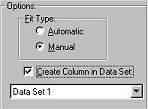
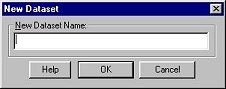
The Create Column in Data Set option will create a column in the data table holding the y-values of the fitted function at each value for the x-axis.You can scroll down and add the new column to an existing data set or to a new data set. You will be prompted to enter a name.
General Equation
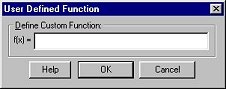
Here you select an equation to be fit to the data. You can either choose a formula from the list in the scrolling box, or you can click the Define Function button and type a formula in the text box. Many common functions, such as linear, exponential, inverse, and polynomial are included in the list.
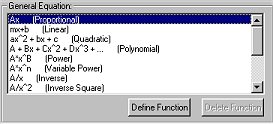
The Degree/Power box is activated and available for editing when the appropriate general equation is selected, e.g. A*x^n (Variable Power).
You can define and add customized mathematical functions to the general equation list. A maximum of five parameters can be using in the equation. Click the Define Function button and type in the function in the box. Delete added functions and equations from the list by highlighting and clicking the Delete Function button.
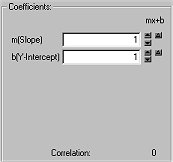
Coefficients
The coefficients can be adjusted individually to improve the fit of the function to the data. Either type in a new value, or use the up and down arrow buttons to step the value of the parameter up and down. The up and down arrow buttons can be used to change the parameter step size.
Depending on the coefficients initially chosen, a function may not fall within the graph window. In this case it may be difficult to adjust the coefficients to achieve a good fit. You may want to calculate the necessary values to force the function to pass through one data point (often the y-intercept) and begin with these values.
Clicking the open triangle ![]() will call up the Automatic Delta dialog:
will call up the Automatic Delta dialog:
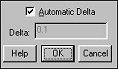
The automatic delta dialog lets you enable/disable an automatic calculation
for the delta to use when using the spin controls to the right of the coefficients.
If you choose to disable the automatic calculation of the delta, you can
type in whatever delta value you like.
After you click OK, a floating box (helper object) containing the equation and fit coefficients of the function will be added to the graph. Black brackets mark the beginning and end of the range. These can be clicked and dragged to adjust the fit. To remove the fitted line, click the box in the upper right corner of the helper object.
Note: For complete details about Curve Fitting,
we recommend that you consult Numerical Recipes in C ©.
The book in its entirety can be viewed at the following address: http://lib-www.lanl.gov/numerical/bookcpdf.html
Toolbar: ![]()
See Also:
NUMERICAL RECIPES IN C: THE ART OF SCIENTIFIC COMPUTING. Copyright © 1988-92 Cambridge University Press.