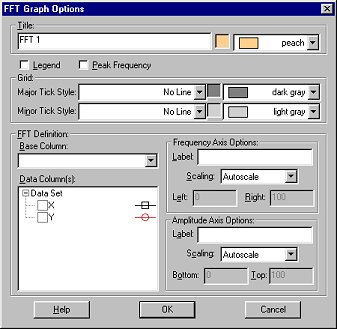
The FFT Graph Options dialog allows you to control how your data are plotted.
Title:
You can add and change the title text and its color as well as remove
the title completely. The title will be placed at the top of the graph.
Legend:
Check this option to display a legend using Data Column labels in the graph window.
Peak Frequency:
If this option is checked, the graph will show the frequency component
with the largest amplitude.
Grid:
Major and Minor Tick Style: select line style for grid lines
Major and Minor Tick Color: select grid line color
FFT Definition:
Base Column: In most cases, only timed data will be used and will be the first column of the data set. Select the column from the pull-down menu.
Data Column: Choose which columns will be analyzed and plotted.
Frequency Axis Options/Amplitude Axis Options: Use this
option to change the label or axis scaling for the frequency axis and/or
the amplitude axis. It is also possible to change the scales on the graph
itself by clicking on the left and right limits on the X-axis or the top
and bottom limits of the Y-axis. You can also use the Autoscale
button in the toolbar.