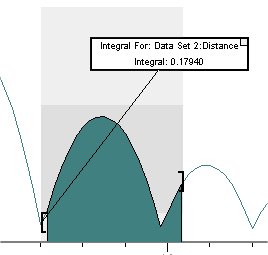
The integral function calculates the area under a segment of the graph. The area is filled on the graph and a floating box (helper object) displays the numeric result. If more than one column is plotted, each plot will be integrated.

Select the portion of the graph that you want to integrate. The direction you move the mouse is not significant.
Choose the integral function either by clicking the Integral icon on the toolbar or by selecting the Integral option from the Analyze Menu. To remove the integral from the graph, click on the small box in the upper-right corner of the floating box (helper object).
The integral is calculated using the trapezoid rule. For example, between adjacent points x1 and x2, the integral of f(x) is given by:
Integral = (f(x1) + f(x2))/2 * (x2-x1)
If the selected region contains more than two x values, the integral
is the sum of the integrals between successive x values.
Toolbar: ![]()
See Also: