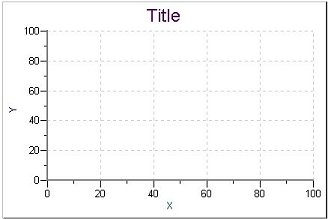
This command creates a new cartesian graph on your page.

Data will not be automatically assigned to the graph, unless a graph already exists in the page. In that case, it will mimic the data plotted on the previous graph. Double-click on the graph or choose Graph Options from the Options Menu to edit the new graph.