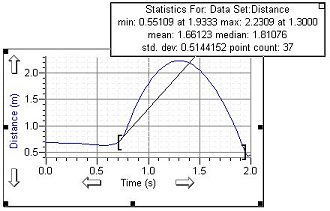
The Statistics feature calculates the minimum, maximum, mean, standard deviation, and number of points of the selected data. A floating box (helper object) which contains the statistics is added to the graph.
You can calculate statistics for either the entire graph or just a selected portion of the graph. Black brackets mark the beginning and end of the selected range. Select Statistics from the Analyze menu or click the Statistics button in the Toolbar. You can click and drag the brackets and the statistics will update automatically. If more than one column is plotted, a selection dialog will open for you to select the columns for statistics calculation.
To remove the statistical analysis, click the close box in the upper
right corner of the floating box (helper object).
Toolbar: ![]()