Data Browser
The Data Browser is a container for all the data in a Graphical Analysis
file. All data may be accessed and manipulated through the Data Browser.
In contrast, a given Data Table will not necessarily
show all data columns.
For basic use of Graphical Analysis, you will not need to use the Data
Browser. By default, all new data columns are added to all data tables.
However, for more complex Graphical Analysis sessions, you may find it
useful to display only a subset of the possible columns in a particular
data table, or you may find it useful to not display a data table at all.
In these cases, you will use the Data Browser to manipulate data columns
and data sets.
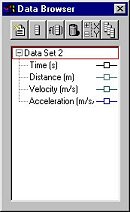 |
Data Browser features:
-
Drag-and-drop from the Data Browser to objects such as tables and graphs.
Drag a column to a y- or x-axis to plot it there; drag a data set to a
table to make it visible there.
-
When the Data Browser is "Active" (it's been clicked on) its appearance
changes to reflect its active state. Edit menu items like Cut, Copy, Paste,
Duplicate, and Select All, will apply to the selected items within the
Data Browser.
-
Options and commands associated with a particular column or data set will
be accessible in the Data Browser via right-click (control-click on Mac)
for options and commands.
|
Six Data Browser toolbar-like buttons provide shortcuts for document-wide
data commands:
Click
To

|
Add a new data set. |

|
Add a new manual column by bringing up the New
Manual Column dialog. |

|
Add a new Calculated Column. |
 |
Expand or collapse the whole tree. |
 |
Whenever a column is selected, click this button and all columns with
that same name will also be selected. |
 |
Delete the currently selected objects. |
All data browser actions are undoable by selecting Edit/Undo.
Tip: The Table Options dialog allows
you to set which columns and data sets are shown in a data table.
Shortcut:
Toolbar: 
See Also:
New Data Set
New Manual Column
New Calculated Column
Delete