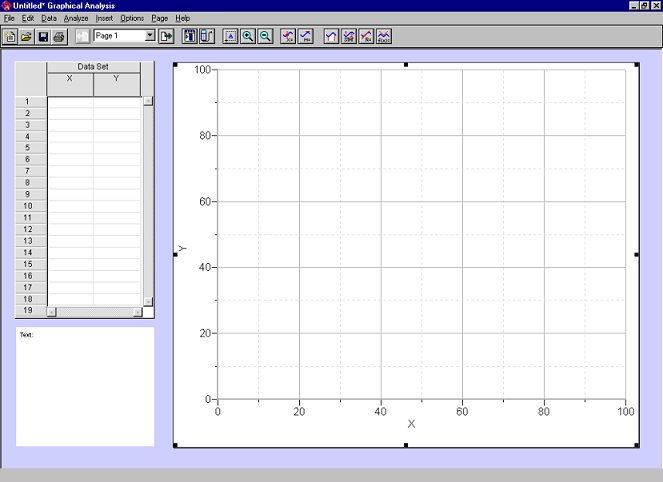
Graphical Analysis Start Up Screen (this can be customized)
The Graphical Analysis screen is divided into several parts, each of which contain different tools and information.
You can get help on any object in the screen by double-clicking on the object and selecting Help from the dialog box.
Graphical Analysis Start Up Screen (this can be customized)
The Menu Bar: Like most applications, Graphical Analysis has a menu bar across the top of the main window. Use the menu bar to access all of the software's features.
Tip: You can access the menus without using the mouse by pressing the <Alt> key (Windows only) and the underlined letter representing the option or command from the menu title itself. This may be faster than using the mouse, especially for features you use often.
You can access some popular menu
options by pressing the <Ctrl> key (Windows) or the ![]() key (Mac) and the corresponding letter for that command.
key (Mac) and the corresponding letter for that command.
The Toolbar: The toolbar appears directly below the menu bar. It contains buttons for the most commonly used features of Graphical Analysis. All of the features available from the toolbar are also available by using the menus. As you move the pointer across a button, you are given a short description of each button.
![]()
Object: An Object is a graph,
table, etc. which exists on the page and which you can create, modify,
and delete. You can create new objects using the commands in the Insert
menu and modify them using the commands in the Options
menu.
The Status Bar: A status bar appears along the bottom of the graph object. When the mouse cursor is moved across the graph, the current coordinates are shown; if the mouse is dragged across the graph, the interval in each direction is shown.
![]()
The Cursors:
|
|
This symbol appears when the cursor is over a cell in the Data Table. |
|
|
The cursor takes on this appearance when it is over the left and right limits on the X-axis or the top and bottom limits of the Y-axis. Once clicked, a box will appear allowing you to change the value. The cursor assumes this shape when a graph title is edited. |
|
|
You can manually rescale or "stretch" the axis by moving the cursor outside the X or Y-axis line. |
|
|
When the cursor is over the graph, you can hold down the mouse button and select a region. This is particularly useful for analyzing regions of a graph. |
|
|
Move the cursor over the arrows to either side of the x-axis or y-axis labels and click the mouse button to scroll along those axes. |
|
|
When an object is selected, its border becomes visible along with eight resizing handles (small black squares). Clicking and dragging a resize handle will resize the object in the appropriate direction. |
|
|
Move the cursor over the edge of the selected object until the cursor turns into a hand, and... |
| ...hold down the mouse button while grabbing and moving the object. |