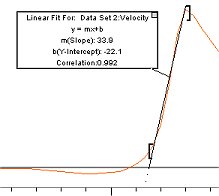
The Linear Fit function fits the line y = m*x + b to the selected region of a graph and reports the slope (m) and y-intercept (b) coefficients. If more than one column is plotted, a selection dialog will open for you to select the columns for regression. You may select more than one column for regression; in this case, a separate fit line will be applied to each graphed column.
You can fit a line either to the whole graph or to a region of interest. Drag the mouse across the desired part of the graph to select it. Black brackets mark the beginning and end of the range.
The Linear fit option is available either by clicking the Linear Fit
button on the toolbar or by selecting it from
the Analyze Menu. You can click and drag
the brackets and the fit will update automatically. To remove the fitted
line, click the box in the upper right corner of the floating box (helper
object).
Toolbar: ![]()
See also: