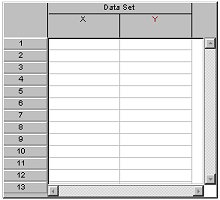
This command creates a new table on your page.
Data will not be automatically assigned to the table, unless a table
already exists in the page. In that case, it will mimic the data plotted
on the previous graph. Double-click on the table or choose Table
Options from the
Options Menu to edit
the new table. You can also add columns by dragging them from the Data
Browser.
See Also: